golang profiling
0. something
平时比较忙,好几次想整理些东西都没能下笔。 今天终于得空,分享下golang性能分析方面的一些东西。因为在公司里维护了一个agent程序,这个程序要部署在几千台服务器上,所以势必要保证它的功能和性能。于是打算看看有哪些地方特别占用计算资源。
1. enable
如何开启golang的pprof呢?
if debugMode(os.Args) {
	cf, err := os.Create("/tmp/cpu.pprof")
	if err != nil {
		fmt.Println(err)
		return
	}
	pprof.StartCPUProfile(cf)
	defer pprof.StopCPUProfile()
}
这里需要提醒下,由于golang是把从CPU的采集数据放在内存中的,在执行 pprof.StopCPUProfile()的时候才会把数据dump到你指定到的文件中,有意思的是如果你 ctril + C 或则 kill 掉你的程序,你都不会拿到这个数据。因为defer在程序kill掉的时候并不会执行,当然你可以放到你的信号处理函数里面,例如:
func Notify() {
	message := make(chan os.Signal)
	for {
		signal.Notify(message, syscall.SIGINT, syscall.SIGUSR1, syscall.SIGUSR2, syscall.SIGHUP, os.Interrupt)
		sig := <-message
		if sig == syscall.SIGUSR1 || sig == os.Interrupt {
			pprof.StopCPUProfile()
			os.Exit(-1)
		}
	}
}
不建议在线上模式打开这个功能。 如果你还是不知道怎么打开这个功能,推荐一篇官方的文章,写的非常好:http://blog.golang.org/profiling-go-programs
2. capture
程序运行一段时间后,会生成一个文件 /tmp/cpu.pprof。这是个pprof文件,可以用google提供的工具进行解析,当然golang也自带了相应的工具。
go tool pprof bin_file /tmp/cpu.pprof
(pprof) top10
99.70s of 128.40s total (77.65%)
Dropped 652 nodes (cum <= 0.64s)
Showing top 10 nodes out of 70 (cum >= 2.39s)
      flat  flat%   sum%        cum   cum%
    43.01s 33.50% 33.50%     43.44s 33.83%  syscall.Syscall
    12.67s  9.87% 43.36%     35.30s 27.49%  strings.FieldsFunc
    11.05s  8.61% 51.97%     11.05s  8.61%  unicode.IsSpace
     9.73s  7.58% 59.55%      9.73s  7.58%  runtime.stringiter2
     5.93s  4.62% 64.17%      5.93s  4.62%  scanblock
     5.11s  3.98% 68.15%      5.11s  3.98%  runtime.osyield
     3.87s  3.01% 71.16%      3.87s  3.01%  runtime.futex
     3.63s  2.83% 73.99%      3.63s  2.83%  runtime.MSpan_Sweep
     2.73s  2.13% 76.11%      2.73s  2.13%  markroot
     1.97s  1.53% 77.65%      2.39s  1.86%  runtime.mallocgc
(pprof)
top10 会显示出cpu使用最多的10个funcs。你也可以使用 -cum 进行排序,如下:
(pprof) top10 -cum
43.31s of 128.40s total (33.73%)
Dropped 652 nodes (cum <= 0.64s)
Showing top 10 nodes out of 70 (cum >= 39.16s)
      flat  flat%   sum%        cum   cum%
         0     0%     0%     90.07s 70.15%  runtime.goexit
         0     0%     0%     72.48s 56.45%  test-agent/scheduler.(\*Scheduler).run
         0     0%     0%     70.70s 55.06%  test-agent/sysinfo.(\*ProcCollector).Run
         0     0%     0%     70.70s 55.06%  test-agent/sysinfo.ProcCollector.Run
     0.03s 0.023% 0.023%     70.48s 54.89%  go.intra.test.com/golang/nux.Procs
     0.20s  0.16%  0.18%     61.55s 47.94%  go.intra.test.com/golang/nux.readTcp
    43.01s 33.50% 33.68%     43.44s 33.83%  syscall.Syscall
     0.06s 0.047% 33.72%     39.21s 30.54%  os.(\*File).Read
         0     0% 33.72%     39.16s 30.50%  syscall.Read
     0.01s 0.0078% 33.73%    39.16s 30.50%  syscall.read
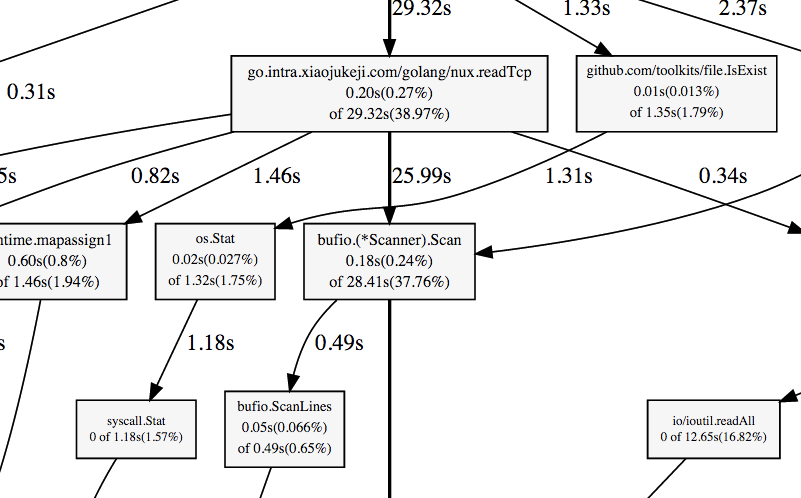
如图:
3. fix
我们看到nux.readTcp这个函数CPU使用率很高,我们执行下 list nux.readTcp :
(pprof) list  go.intra.test.com/golang/nux.readTcp
Total: 2.14mins
ROUTINE ======================== go.intra.test.com/golang/nux.readTcp in /home/libk/src/go.intra.test.com/golang/nux/proc.go
     200ms   1.03mins (flat, cum) 47.94% of Total
         .          .    193:   if err != nil {
         .          .    194:           return res
         .          .    195:   }
         .          .    196:   defer f.Close()
         .          .    197:   scanner := bufio.NewScanner(f)
         .       20ms    198:   scanner.Scan()
      40ms     24.95s    199:   for scanner.Scan() {
      70ms     34.22s    200:           s := strings.Fields(scanner.Text())
      50ms      110ms    201:           if s[3] != "01" { //only established
         .          .    202:                   continue
         .          .    203:           }
      20ms      490ms    204:           inode, err := strconv.ParseUint(s[9], 10, 64)
      20ms       20ms    205:           if err != nil {
         .          .    206:                   continue
         .          .    207:           }
         .      1.69s    208:           res[inode] = true
         .          .    209:
         .          .    210:   }
         .       50ms    211:   return res
         .          .    212:}
         .          .    213:
         .          .    214:func tcpEstablishCount(inodes map[uint64]bool, pid int) int {
         .          .    215:   res := 0
         .          .    216:   dir := fmt.Sprintf("/proc/%d/fd", pid)
(pprof)
可以明显的看到agent依赖一个lib,在读取linux的tcp信息的时候非常耗时间。让我们来改造下:
    var mutex sync.Mutex
    for scanner.Scan() {
        go func(){
            mutex.Lock()
            defer mutex.Unlock()
            s := strings.Fields(scanner.Text())
            if len(s) < 4 || s[3] != "01" { //only established
                return
            }
            inode, err := strconv.ParseUint(s[9], 10, 64)
            if err != nil {
                return
            }
            res[inode] = true
        }()
    }
这里需要提到的一点是不要忘记给map加锁,并发读写,map会hold不住
之前的if可能会因为数组越界而panic:
panic: runtime error: index out of range

goroutine 4694 [running]:
go.intra.test.com/golang/nux.func·001()
        /home/libk/src/go.intra.test.com/golang/nux/proc.go:206 +0x22d
created by go.intra.test.com/golang/nux.readTcp
        /home/libk/src/go.intra.test.com/golang/nux/proc.go:214 +0x361
ok,改造完成,重新编译打包,跑一跑,采集下数据。
可能以后会经常加一些新功能,为了方便调试程序,我写了个 debug 子命令来启动程序,采集时间用 -t(min) 指定,例如:
/usr/local/sbin/agent debug -t 180
程序采集3个小时的数据会自动停止,如果你启动了monit或则supervisord,他们会把程序以正常的模式拉起,现在你可以静下心来去Dota了。
4. wtf
4.1
(pprof) top10 -cum
104.20s of 261.51s total (39.85%)
Dropped 681 nodes (cum <= 1.31s)
Showing top 10 nodes out of 71 (cum >= 42.24s)
flat flat% sum% cum cum%
0.02s 0.0076% 0.0076% 101.32s 38.74% runtime.goexit
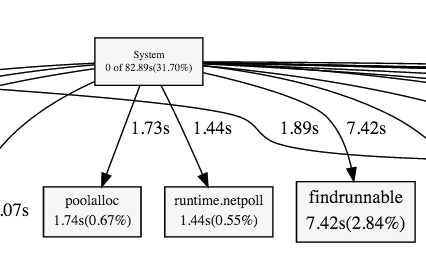
0 0% 0.0076% 82.89s 31.70% System
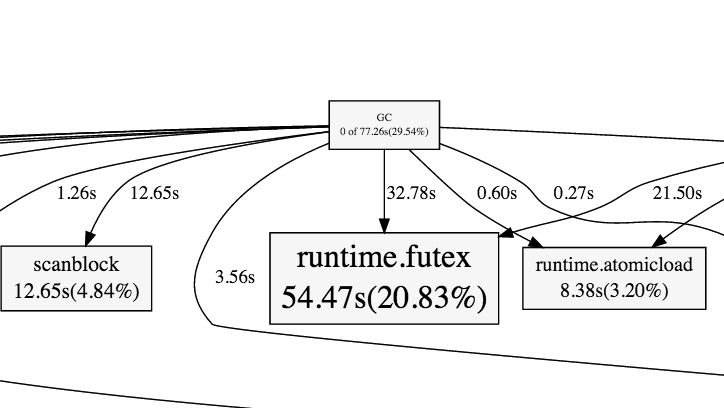
0 0% 0.0076% 77.26s 29.54% GC
54.47s 20.83% 20.84% 54.47s 20.83% runtime.futex
47.87s 18.31% 39.14% 48.24s 18.45% syscall.Syscall
0.02s 0.0076% 39.15% 44.09s 16.86% syscall.Read
0.02s 0.0076% 39.16% 44.08s 16.86% os.(\*File).Read
0.03s 0.011% 39.17% 44.07s 16.85% syscall.read
0.03s 0.011% 39.18% 44.06s 16.85% os.(\*File).read
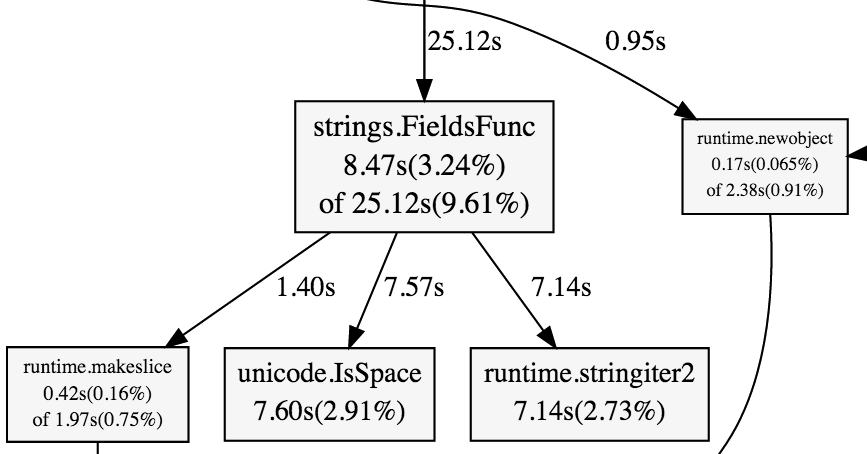
1.74s 0.67% 39.85% 42.24s 16.15% go.intra.xiaojukeji.com/golang/nux.func·001
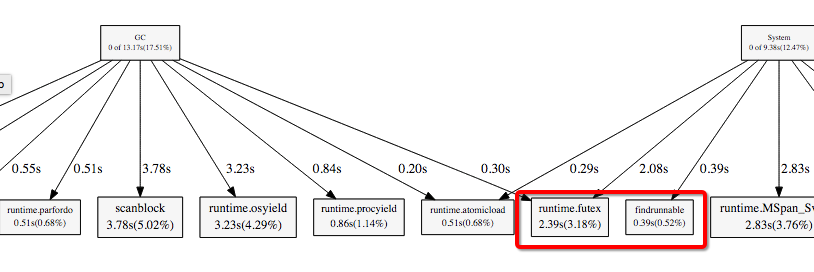
跑了三个小时,晚上12点打开笔记本看看收获,如上图,真是瞎了,GC 和 system 的CPU飙升,虽然现在版本的GC还不是很完美,但是总感觉还有问题,futex的飙升可能是自己锁了太多的东西,于是又改了下,打算跑一个晚上,明天上班的时候再看下:
    var mutex sync.Mutex
    for scanner.Scan() {
        go func(){
            s := strings.Fields(scanner.Text())
            if len(s) < 10 || s[3] != "01" { //only established
                return
            }
            inode, err := strconv.ParseUint(s[9], 10, 64)
            if err != nil {
                return
            }
            mutex.Lock()
            res[inode] = true
            mutex.Unlock()
        }()
    }
4.2
呃,今天果然迟到了。看看昨天的数据吧
(pprof) top10 -cum
151.97s of 588.83s total (25.81%)
Dropped 865 nodes (cum <= 2.94s)
Showing top 10 nodes out of 76 (cum >= 123.43s)
flat flat% sum% cum cum%
0.11s 0.019% 0.019% 335.79s 57.03% runtime.goexit
0 0% 0.019% 169.38s 28.77% System
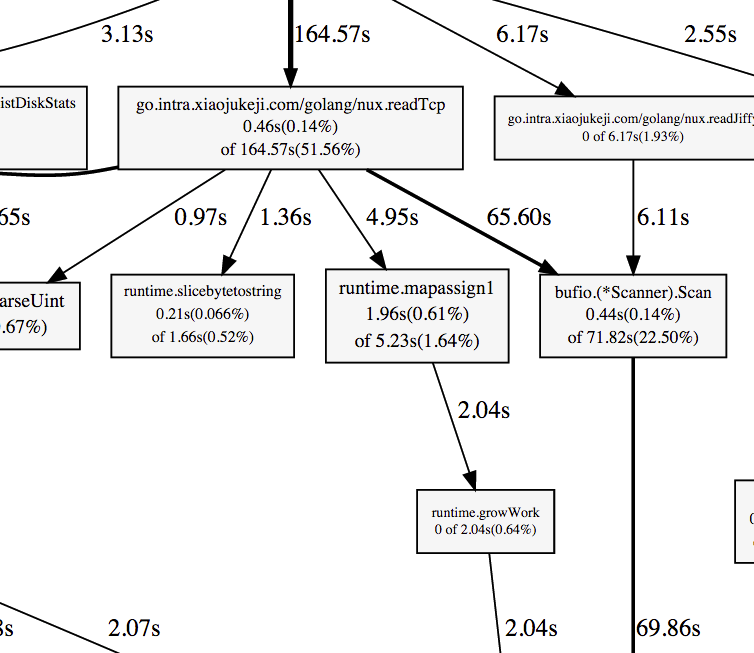
3.38s 0.57% 0.59% 151.73s 25.77% go.intra.xiaojukeji.com/golang/nux.func·001
147.71s 25.09% 25.68% 149.18s 25.33% syscall.Syscall
0.05s 0.0085% 25.69% 134.13s 22.78% syscall.Read
0.08s 0.014% 25.70% 134.11s 22.78% os.(\*File).Read
0.01s 0.0017% 25.70% 134.08s 22.77% syscall.read
0.05s 0.0085% 25.71% 134.03s 22.76% os.(\*File).read
0 0% 25.71% 130.31s 22.13% collect-agent/scheduler.(*Scheduler).run
0.58s 0.099% 25.81% 123.43s 20.96% strings.Fields
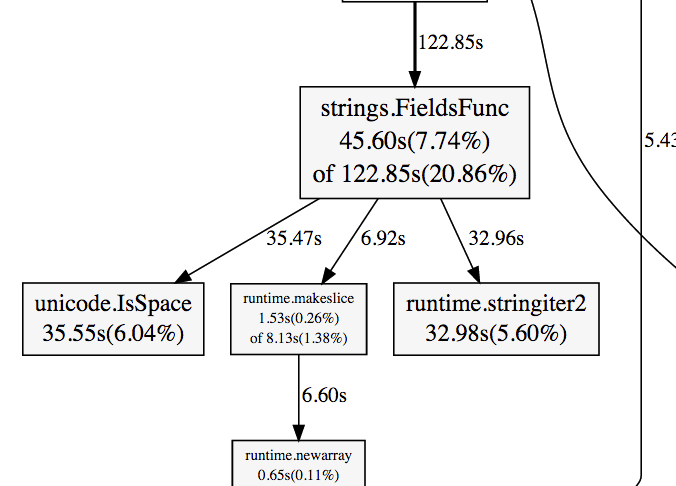
只lock map 的话,果然runtime.futex的cpu占用减少了,但是strings.Fileds的性能感觉还是不太好,虽然比一开始降低了9个百分点,但是毕竟还是高达20%,于是打算再次改进。
要读取的文件是 /proc/net/tcp
按行读取的内容为:
   8: 6608DE0A:C4D1 8F3A8DD1:0050 00 00000000:00000000 00:00000000 00000000     0        0 0 1 ffff88081749c1c0 51 4 4 10 -1
   9: 6608DE0A:B4E0 8F3A8DD1:0050 01 00000000:00000000 00:00000000 00000000     0        0 210682501 1 ffff880734434640 51 4 4 10 -1
6780: 6608DE0A:AC46 8F3A8DD1:0050 01 00000000:00000000 00:00000000 00000000     0        0 207111168 1 ffff88078fffa1c0 58 4 4 10 -1
6781: 6608DE0A:9DD0 8F3A8DD1:0050 01 00000000:00000000 00:00000000 00000000     0        0 203774418 1 ffff880814149300 95 4 2 2 7
6782: 6608DE0A:7740 8F3A8DD1:0050 01 00000000:00000000 00:00000000 00000000     0        0 203696117 1 ffff880814348140 49 4 4 10 -1
6783: 6608DE0A:8345 8F3A8DD1:0050 01 00000000:00000000 00:00000000 00000000     0        0 205045633 1 ffff8807375ec240 95 4 4 2 -1
 46: 010310AC:9C4C 030310AC:1770 01
   |      |      |      |      |   |--> connection state
   |      |      |      |      |------> remote TCP port number
   |      |      |      |-------------> remote IPv4 address
   |      |      |--------------------> local TCP port number
   |      |---------------------------> local IPv4 address
   |----------------------------------> number of entry

   00000150:00000000 01:00000019 00000000
      |        |     |     |       |--> number of unrecovered RTO timeouts
      |        |     |     |----------> number of jiffies until timer expires
      |        |     |----------------> timer_active (see below)
      |        |----------------------> receive-queue
      |-------------------------------> transmit-queue

   1000        0 54165785 4 cd1e6040 25 4 27 3 -1
    |          |    |     |    |     |  | |  | |--> slow start size threshold,
    |          |    |     |    |     |  | |  |      or -1 if the threshold
    |          |    |     |    |     |  | |  |      is >= 0xFFFF
    |          |    |     |    |     |  | |  |----> sending congestion window
    |          |    |     |    |     |  | |-------> (ack.quick<<1)|ack.pingpong
    |          |    |     |    |     |  |---------> Predicted tick of soft clock
    |          |    |     |    |     |              (delayed ACK control data)
    |          |    |     |    |     |------------> retransmit timeout
    |          |    |     |    |------------------> location of socket in memory
    |          |    |     |-----------------------> socket reference count
    |          |    |-----------------------------> inode
    |          |----------------------------------> unanswered 0-window probes
    |---------------------------------------------> uid
我最终想拿到的是connection state 和 inode 来统计程序的连接数目,因为格式 和 空格的数量都是不确定的,所以当时可能选择了Fileds这个函数,看了下linux内核的源码,我发现每行是定长的(149),于是有了下面的思路:
From: https://github.com/torvalds/linux/blob/master/net/ipv4/tcp_ipv4.c
\#define TMPSZ 150

static int tcp4_seq_show(struct seq_file *seq, void *v)
{
	struct tcp_iter_state *st;
	struct sock *sk = v;
	seq_setwidth(seq, TMPSZ - 1);
........
    for scanner.Scan() {
            b := []byte(scanner.Text())
            if len(b) != 149 || b[34] != 48 ||  b[35] != 49  { //only established
                continue
            }
            start := 91
            end := start
            for end=start; b[end] != 32 ; end++{}
            inode, err := strconv.ParseUint(string(b[start:end]), 10, 64)
            if err != nil {
                continue
            }
            res[inode] = true
    }
前面几次修改虽然加了并发,是有可能丢数据的,因为你并不知道goroute什么时候结束。还好scanner.Scan()的效率并不高。由于并发的话没法知道起了多少goroute ,所以没法等待,设定个 timeout 感觉太傻,既然最耗时的 Fileds 去掉了,索性就把并发去掉吧,这样把锁也去掉了,加锁的话 对runtime压力太大了。综合来看,成千上万个goroute加锁,感觉顺序执行效率更高一些。
去掉了 strings.Fileds 函数, 把 string 转化为 []byte 进行处理,不知道会不会更快,ok,再跑两个小时。。。
4.3
饿 ,结果出来了。还不错