流量异常行为检查算法
1. 基础 - 异常行为检查算法
异常行为检查算法可以分为3步,每一步都基于前一步。
- 拥有一个随时间序列变化,预测未来值的算法
- 在真实的观测值和预测值之前计算出一个差值
- 最后,建立一套机制用于判断所观测到的值是否异常,什么时候出现的异常
所有移动平均法都存在很多问题。
它们都太难计算了。每个点的计算都让你绞尽脑汁。而且也不能通过之前的计算结果推算出加权移动平均值。 移动平均值永远不可能应用于现有的数据集边缘的数据,因为它们的窗口宽度是有限的。这是一个大问题,因为数据集边缘的变动形态一般都是我们最感兴趣的部分。
类似地,移动平均法也不能应用于现有数据集的范围之外。其结果是,它们对预测毫无用处。 幸运的是,有一种很简单的计算方案能够避免所有这些问题。它叫指数平滑法(exponential smoothing)或Holt-Winters法。指数平滑法有几种不同形式:一次指数平滑法针对没有趋势和季节性的序列,二次指数平滑法针对有趋势但 没有季节性的序列。术语“Holt-Winters法”有时特指三次指数平滑法。 所有的指数平滑法都要更新上一时间步长的计算结果,并使用当前时间步长的数据中包含的新信息。它们通过“混合”新信息和旧信息来实现,而相关的新旧信息的权重由一个可调整的拌和参数来控制。各种方法的不同之处在于它们跟踪的量的个数和对应的拌和参数的个数。
2. 进阶 - 利用rrdtool进行数据收集
关于rrdtool的基础这里就不再赘述了,首先你要新建rrd文件,举个例子:
rrdtool create monitor.rrd –s 300 \
DS:ifOutOctets:COUNTER:1800:0:4294967295 \
RRA:AVERAGE:0.5:1:2016 \
RRA:HWPREDICT:1440:0.1:0.0035:288
关于HWPREDICT的介绍如下:
RRA:HWPREDICT:<array length>:<alpha>:<beta>:<period>

Where:
<array length> is the number of predictions to store before wrap-around; this number must be longer than the seasonal period. This value will also be the RRA row count for DEVPREDICT RRA.
<alpha> is the intercept adaptation parameter, which must fall between 0 and 1. A larger value means the intercept adapts faster. The same value will be also be used for gamma.
<beta> is the slope adaptation parameter, again between 0 and 1.
<period> is the number of primary data points in the seasonal period. This value will be the RRA row counts for the SEASONAL and DEVSEASONAL RRAs.

Using this option creates the FAILURES RRA with the default window length of 9 and a default threshold value of 7. The default length of the FAILURES RRA is one period.
等待一段时间,收集够一定的数据后,就可以画图了,如下:
rrdtool graph example.gif \
DEF:obs=monitor.rrd:ifOutOctets:AVERAGE \
DEF:pred=monitor.rrd:ifOutOctets:HWPREDICT \
DEF:dev=monitor.rrd:ifOutOctets:DEVPREDICT \
DEF:fail=monitor.rrd:ifOutOctets:FAILURES \
TICK:fail#ffffa0:1.0:"Failures Average bits out" \
CDEF:scaledobs=obs,8,* \
CDEF:upper=pred,dev,2,*,+ \
CDEF:lower=pred,dev,2,*,- \
CDEF:scaledupper=upper,8,* \
CDEF:scaledlower=lower,8,* \
LINE2:scaledobs#0000ff:"Average bits out" \
LINE1:scaledupper#ff0000:"Upper Bound Average bits out" \
LINE1:scaledlower#ff0000:"Lower Bound Average bits out"
3. 成果 - 展示图形
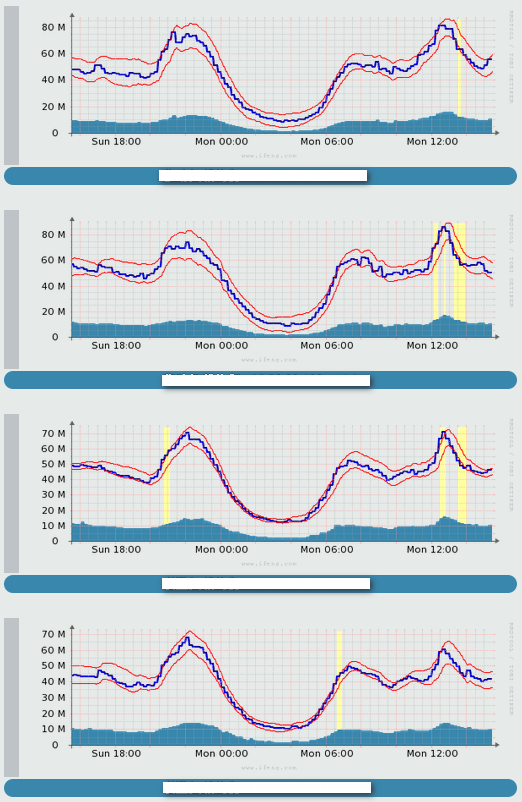
黄色区域为流量异常的时段
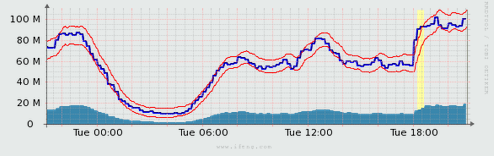
2014年7月29日18点 由于某事件的公布“***审查立案”,准确扑捉到异常突发流量。
参考文献: * http://static.usenix.org/legacy/publications/library/proceedings/lisa2000/full_papers/brutlag/brutlag_html/ * http://cricket.sourceforge.net/aberrant/rrd_hw.htm